Friday, 28 December 2012

How to Assess Your 2012 Portfolio Performance

The end of 2012 is upon us so it is opportune to review how our own individual portfolio has performed over the past year. This forms a necessary part of an annual investment review, which we wrote about in two parts here (goals, performance, rebalancing issues) and here (taxes).

Judging whether performance is good or bad can be absolute - do we have more money than we did last year? - or relative - have we done better than some benchmark like "the market"? Both might be relevant. The absolute measure is useful for seeing how close we are to a goal while the relative tells us whether we are doing a good job managing investments.

Absolute performance
If we only have only have investment account and neither contributed nor withdrew cash during the year, then the calculation of investment performance is dead simple - take the end of December 2011 and 2012 account statement balances and see what the percentage or dollar difference is. Then subtract inflation, which is probably going to end up being about 1% for the year (check the CPI for December on the Bank of Canada website here when it comes out sometime in January), to see the net gain in real spending power.

Unfortunately, most investors face two calculation complications - 1) multiple accounts like RRSPs, TFSAs, RRIFs, RESPs, LIRAs, taxable accounts and 2) cash flow contributions going in or withdrawals coming out of accounts. Arriving at a representative rate of return considering the timing and size of such cash flows can be tricky. Online brokers will usually show you a return for each account but not across multiple accounts.

Modified Dietz is a good method - A well-accepted procedure for coming up with a performance number is the modified Dietz method, described in detail on Wikipedia. The formula looks daunting but fear not, PWL Capital's Justin Bender recently posted in PWL 2012 Rate of Return Calculator a link to a free downloadable spreadsheet that does the job. All we investors need to do is enter month end account balance totals and cash contributions or withdrawals. Bender's post even walks us through how to do it.

Relative performance
Once we have the return on our own holdings we can then compare to some benchmark. But the question arises: what is the proper benchmark? It certainly is not a fair comparison to take something like the S&P/TSX Composite Index quoted on many news websites. First, the index almost always shows only the index price level change and fails to include dividends or distributions that make up a significant portion of total returns (see our very popular post on the subject of total returns). Second, most portfolios contain more asset classes than just Canadian equities, by including such others as US, international and emerging market equities, bonds and REITs. Third, indices do not subtract management fees and other expenses that limit the practical possibilities for returns the investor faces in the real world.

Compare with ready-made real total return portfolios - The simplest and most effective way to address all the above issues is to compare with portfolios of ETFs such as those below. Make sure that the asset classes within match as closely as possible with your own portfolio. Then pull up the performance numbers from the ETF provider website. The following portfolio ETFs contain only ETFs built with the standard cap-weighted passive index holdings that are generally accepted benchmarks of market returns. They also have the convenient advantage of converting and expressing foreign holdings and performance into Canadian dollars. The returns below from the iShares website show one-year returns up to December 27th close of business.
Another possible benchmark is the One-Minute Portfolio by Larry MacDonald, who reports its 2012 performance on the Canadian Business website. It has a mix of two ETFs -  iShares S&P/TSX 60 Index Fund (XIU) i.e. holdings of Canadian equities, and the iShares Canadian Bond Index Fund (XBB). For 2012, it held 70% XIU and 30% XBB.
  • One-Minute Portfolio: 2012 return "nearly 6%"

Compare with the Asset Mixer - Another way to approximate returns that can align asset allocation percentages more precisely with your own portfolio is to use the Stingy Investor Asset Mixer. The Mixer lets one plug in any percentage for a broad variety of asset classes. The minor downside is that the fees/costs estimate is a round number typical of various types of fund. The year-to-year variations in returns amongst asset classes tend to overwhelm fee differences, so the closer alignment with asset class proportions is a very useful view to obtain. Stingy Investor Norm Rothery has usually updated the annual performance figures around the end of January so look for 2012 data in a month or so.

As can be seen from the above benchmark portfolio returns, there can legitimately be a wide range of 2012 returns for different portfolio structures. Getting the right numbers, both for one's own portfolio returns and for a benchmark, is essential to be able to make correct fact-based judgments and decisions for 2013 and beyond.

Disclaimer: this post is my opinion only and should not be construed as investment advice. Readers should be aware that the above comparisons are not an investment recommendation. They rest on other sources, whose accuracy is not guaranteed and the article may not interpret such results correctly. Do your homework before making any decisions and consider consulting a professional advisor.

Friday, 21 December 2012

Good Christmas Buys Amongst the Low EPS Dispersion Stocks

In last week's post we ranked large cap Canadian stocks according to the tightness of the spread of future analyst earnings forecasts. We found that the lowest earnings dispersion stocks had been doing rather well - they had no recent losses and trailing 5-year returns for shareholders were solidly positive almost in every case. That certainly looks promising but we concluded on the cautious note, saying that these stocks might not be attractively priced at the moment. Are there any good Christmas season buys amongst them?

Let's try to go a step further and try to address that issue by looking at measures of price attractiveness, and at profitability, dividend growth and analyst forecasts. We are looking for patterns and consistency not a definitive answer based on a single number.

Screening out stocks that are a bit too extreme
Keeping with theme of safe, profitable companies we remove (again using the handy GlobeInvestor My Watchlist tool) from our list stocks with:
  • Price/Earnings (P/E) over 18
  • Price/Sales (P/S) over 4, except for REITs where we used 8
  • Price/Book Value over 3
  • No dividend growth in the past 5 years
  • No Earnings Per Share (EPS) growth over the past five years
  • Return On Equity (ROE) under 10%
Just to be sure we didn't miss any opportunities, we started with the top list of "More reward than risk" stocks plus the top half of the next group, the stocks under the heading "Potential Reward but Appreciable Risk Too". But that didn't change much - after applying our screens only one company from the second group of stocks, Empire (EMP.A), remained in contention. We are left with 17 stocks to examine further.

Assessing the stocks vs industry benchmarks and the TSX's leading ETF
The next step was to compare each stock's numbers against its industry averages (obtained from TD Waterhouse) since each industry can have differing good vs bad values (as is the case for REITs with the notably higher P/S ratio). Though not a screening criteria, we added Price/Cash Flow as a comparator since cold hard cash flowing is like the lifeblood of any company.

We also took as a benchmark comparator the dominant broad market ETF for large caps in Canada, the iShares S&P/TSX 60 Index (TSX: XIU). After all, if we cannot find anything more attractive than the overall index, why bother?

Return On Equity, EPS growth and dividend growth over the past 5 years are the measures we have used to assess the strength of the company.

Automated and human analyst stock ratings
Opinions about the future, prone to error as they might be (see our previous post Stock Market Analyst Forecasts: add Salt and Pepper), can add another dimension to our assessment. We've included the average of analysts' ratings as found in the My Watchlist, as well as the rating from a new automated tool offered by BMO Investorline to its clients, the Value Analyzer from Recognia. As if to prove that nothing is really obvious or certain about the future of these stocks, in three cases (highlighted with a red outline box in our comparison table below) the human and automated analysts give opposite recommendations!

Results - more than half of the stocks appear to be reasonably priced
Without using a mathematical formula, we looked at the stocks with the most favorable green factors and the least unfavourable orange factors to come up with an overall assessment.

Most, 11 of 17, or about two-thirds, of the stocks look to be reasonable buys at the moment. It is a close call among them, especially among the banks, as to which should be rated not worth buying at the moment.

At this point, we could delve into what the future could hold different for these companies through reading the commentary by management in financial reports and investor presentations or by analysts (many available to clients on their discount broker website) or by investors on chat sites (see our post on the Best of the Online Investing Discussion Forums). The companies have all been quite successful up to now and most will continue to be so, but some will not. It is very difficult to put a highly confident conclusion on such information and we will not attempt to do so. Even with such solid stocks, there is some risk and uncertainty about the future.

Merry Christmas!

Disclaimer: this post is my opinion only and should not be construed as investment advice. Readers should be aware that the above comparisons are not an investment recommendation. They rest on other sources, whose accuracy is not guaranteed and the article may not interpret such results correctly. Do your homework before making any decisions and consider consulting a professional advisor.

Disclosure: I own shares of several companies reviewed above, including Metro, National Bank, Bank of Montreal, Scotiabank, Boardwalk and RioCan in direct individual holdings, plus all of the companies within ETFs.

Friday, 14 December 2012

Using the "Wisdom of Crowds" of Analysts to Find Safe, Profitable Canadian Stocks

James Surowiecki's best selling book The Wisdom of Crowds explains how combining the opinions groups of people can produce better decisions and numerical estimates than those of individual experts in a field.

Along the same vein, academic finance researchers some years ago discovered that it is worth looking at the opinions of professional stock analysts collectively instead of only individually (e.g. see Differences of Opinion and the Cross-Section of Stock Returns by Karl Diether, Christopher Malloy and Anna Scherbina and most recently Analyst Forecast Dispersion and Aggregate Stock Returns by Guang Ma, which reviews and summarizes other papers up to 2011). What the researchers specifically found was that the dispersion or range of earnings estimates could predict to some degree future returns. The lower the range of estimates, the better the future returns or conversely, the greater the range of estimates, the lower the future returns. It seems the issue is mainly about true uncertainty as to where a company is heading, which makes intuitive sense - if analysts cannot agree, widely diverging futures are more likely. For an investor that is useful information about risk, or conversely, safety.

Collecting the list of Canadian stocks to analyze
We decided to have a look at bigger companies trading on the TSX to test the idea. The more opinions / estimates the better should be the results and bigger companies tend to have more analysts following them and forecasting earnings. We merged the list of holdings from three mainstream Canadian equity ETFs to come up with 110 stocks - the cap-weighted iShares S&P/TSX 60 Index Fund (TSX symbol: XIU); the accounting factor weighted PowerShares FTSE RAFI Canadian Fundamental Index ETF (PXC) and; the low beta BMO Low Volatility Canadian Equity ETF (ZLB).

We collected most of the base data by entering the stock symbols in Globe Investor's My WatchList, then downloaded the spreadsheet to our own PC to add the key column (outlined in blue) where we compare the spread between the highest and the lowest analyst estimate of next year's (2013) earnings per share (EPS). Most of the EPS figures come from Yahoo Finance, where a Quote page for any stock has an Analyst Estimates link on the left side of the page (e.g. for Royal Bank here). Unfortunately, Yahoo does not have coverage for all the stocks in our list, so we turned to our own discount broker BMO Investorline (other brokers may have this data too) to get the missing ones, shown by the cells in yellow in the comparison table. (That filled in every stock except for Onex Corporation for some reason - do no analysts cover the company? Another company Superior Plus we decided to put aside as only two analysts cover it.)

Result - A definite pattern: low dispersion equals better past returns
Sorting the stocks from lowest to highest dispersion of EPS estimates in our series of comparison tables below seems to align on average with better performing stocks, though of course there are exceptions.

The lowest dispersion stocks display multiple desirable features:
  • more consistent profitability - positive earnings, no losses, they are all making profits
  • more stability - smaller recent earnings and sales surprises; none of the stocks' beta is above the market average of 1.0, most are well below (beta is a measure of the volatility of a stock's price relative to the TSX market average - a beta of 0.5 means that if the market moves down, or up, 2.0% the stock will move only 0.5 x 2.0% = 1% down, or up)
  • positive compound 5-year returns (observe the very few red negative numbers near the top of the list). 
We should point out that we have here compared past results with current future-looking estimates, whereas the research looked at the future earnings estimates against future subsequent returns. However, if the research papers are right, for most of these companies, the past will be like the future and shareholders will continue to smile.
Slow and steady stocks seem to win the race on average
Though the trailing 5-year returns are positive, most are single digit and the first stock with extremely high annual 22% compound 5-year returns is Alimentation Couche-Tard in 32nd place for low analyst dispersion. The highest 30+% per year stocks are mixed in amongst the big losers.

No surprise - Industries like banks, real estate, insurance companies, utilities, consumer staples, telecomms have less dispersion
The image of stability of companies in these sectors gets borne out by the data.

No surprise - Low volatility, low beta stocks have tight earnings estimates
The same stability that results in analysts getting quite close to each other's estimates along with smaller profits and sales surprises also results in a stable stock price and low beta. ZLB naturally contains more of these stocks than other ETFs as it selects its holdings based on low beta.

The winners - More Reward than Risk
We divided all the stocks into three approximately equal-sized groups. This one looks quite attractive.

In between - Potential Big Reward but Appreciable Risk Too

Unattractive - More Risk than Reward

Bottom line: This data should not be a stock selection decider on its own as other factors like accounting ratio analysis should enter the decision process - a good company may not be an attractive buy at current prices. However, the dispersion of analyst estimates is an additional useful tool in the investor's assessment kit bag.

Disclaimer: this post is my opinion only and should not be construed as investment advice. Readers should be aware that the above comparisons are not an investment recommendation. They rest on other sources, whose accuracy is not guaranteed and the article may not interpret such results correctly. Do your homework before making any decisions and consider consulting a professional advisor.

Friday, 7 December 2012

Mortgage/Debt-Adjusted Asset Allocation

Last week, we discussed how to figure out the effect of taxes in arriving at a true picture of asset allocation. This week we look at how a home mortgage should be taken into account.

A mortgage is like a negative bond
A mortgage is a large debt. In the investment context, a mortgage works the opposite of a bond. Instead of being an asset like a bond that pays you interest, it is a liability with interest and principal that you must pay.

A mortgage on a home has no income tax consequences. The borrowing costs are after-tax, the costs are not tax deductible and there is no capital gains tax to pay on your home (providing of course that it qualifies as your principal residence - see the Canada Revenue Agency rules) when you sell it.

The home is also an asset with a market value. For most people, the value of their home and the size of the mortgage are very significant in their overall financial picture, as we see in the example below.

Example
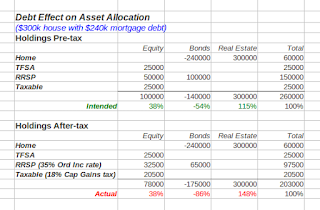
  • Home valued at $300,000 and a mortgage of $240,000. This is the new maximum 80% loan-to-value ratio for refinancing instituted in July 2012, when the federal government issued more restrictive rules to cool Canada's housing market. 
  • Financial assets are $200,000 (pre-tax), half in equities, half in bonds across taxable, TFSA and RRSP accounts, as in last week's post.

In our example, the home dominates the investor's total asset allocation. The investor's wealth is very concentrated in that one asset. There is a significant amount of leverage, as indicated by the large negative (-86% after-tax) in the bonds column.

Leverage entails risk and no one wants to lose their home. A critical question therefore is whether the mortgage payments can be maintained. Different people can have markedly different risk depending on their job security.

Invest in mortgage or RRSP?
Thinking of a home within the investment asset allocation raises the oft-asked question of whether to put extra cash towards paying down the mortgage or contributing to an RRSP or TFSA. The simple answer, as TaxTips.ca shows here, is to pick the one that has the highest return (TFSA or RRSP) or interest rate (mortgage). York University professor Moshe Milevsky elaborates on the logic in this article from the International Finance and Insurance Decisions Center.

Home is not an investment asset exactly like stocks and bonds
Milevsky (here in the Globe and Mail and in several videos on his website) and others such as financial advisor and author Larry Swedroe (here on CBS News) say a home is as much consumption as investment due to all the maintenance costs and property taxes and the modest long term returns (see blogger Preet Banerjee's post with stats up to 2008 and Milevsky's Houset Allocation with stats up to 2004). A house also differs in that it is one big indivisible lumpy holding. As a result the usual investment allocation fix of re-balancing cannot work. Later in life, when the mortgage has been paid off and other savings have built up, the mix of assets will not look nearly so lop-sided - e.g. this example where there is no mortgage and pre-tax financial assets have doubled.
One aspect of houses generally benefits the investor - house prices over the long term have a low correlation with the stock market (Milevsky's Houset article contains a table of correlations of real estate in various Canadian localities with the Canadian TSX and the US S&P 500), which means that prices follow a different pattern of ups and downs and when the stock market tanks, house prices don't usually follow suit. Total wealth gains greater stability. 

Over the short term, there might well be high correlation and simultaneous drops, as was the case from 2008 to nowadays in the USA when housing collapsed along with the stock market. Individual circumstances can also change the real estate correlation, for example owning a house in a one industry town and owning lots of shares of that company. A perfect storm could ensue - the company runs into trouble, its stock plummets, it shuts the local plant location, you lose your job and local real estate flounders.

Other kinds of debt
The same approach can be used to assess non-mortgage debt, whether it is used for investing, as we examined last year in Borrowing to Invest: When & How to Do It or simply to pay for consumption spending. The debt appears as a negative amount and if the debt buys returns-producing assets, that value shows as well.


A primary objective of asset allocation is to be aware of and to manage risk. We hope readers agree that taking the home mortgage and value into account is an important step in that process.

Disclaimer: this post is my opinion only and should not be construed as investment advice. Readers should be aware that the above comparisons are not an investment recommendation. They rest on other sources, whose accuracy is not guaranteed and the article may not interpret such results correctly. Do your homework before making any decisions and consider consulting a professional advisor.